

Translate this page into:
A Study of Blood Viscosity and Inflammatory Biomarkers’ Levels in Bilateral Primary Varicose Veins/Reticular Veins as Predictive Markers

* Corresponding author: Dr. Mukul Urvendra Dahiya, Department of General Surgery, Moti Lal Nehru Medical College, Prayagraj, India. dr.mukuldahiya@gmail.com
-
Received: ,
Accepted: ,
How to cite this article: Dahiya MU, Singh S, Singh S, Singh SK, Kumar V. A Study of Blood Viscosity and Inflammatory Biomarkers’ Levels in Bilateral Primary Varicose Veins/Reticular Veins as Predictive Markers. Int J Recent Sur Med Sci. 2024;10:57-62. doi: 10.25259/IJRSMS_4_2023
Abstract
Objectives
Cross-sectional data was collected for a period of 1 year to assess the biomarkers of inflammation, and blood viscosity as predictive markers in patients with primary bilateral varicose veins or reticular veins that might progress to varicose veins.
Material and Methods
A sample of 40 participants, 20 controls and 20 patients aged 18–65 years falling under the reticular veins and symptomatic varicose veins (C1, 2s), primary etiology (Ep), superficial veins (As), reflux pathology (Pr) categories of Clinical, etiologic, anatomic, Pathophysiologic (CEAP) classification with the exception of telangiectatic veins, were included in the study. Blood viscosity was measured using a Capillary Viscometer. Evaluated inflammatory markers were tissue Plasminogen Activator (tPA), Plasminogen Activator Inhibitor-1 (PAI-1), and fibrinogen. Analysis was done using Statistical Package for the Social Sciences (SPSS) software and Chi-square, Fisher’s, Bonferroni, and Analysis of Variance (ANOVA) tests were applied.
Results
There was a statistically insignificant relationship between occupation and different study groups. Standing hours and serum fibrinogen levels had a significant difference in different study groups. Serum tPA, Serum PAI-1, and blood viscosity had an insignificant difference between different study groups. It was revealed that the pairwise group comparisons of study group C2 vs. control group C0, study group C1 vs. control group C0 and study group C2 vs. study group C1, and study group C2 vs. control group C0 each were significantly different pairwise.
Conclusion
Blood viscosity, tPA and PAI-1 cannot be used as predictive markers in patients with bilateral (B/L) primary varicose veins/reticular veins. Serum fibrinogen levels can be used as predictive markers for the development of B/L primary varicose veins and in our particular study with a predictive range of 189.4–327.9 mg/dL but not for B/L reticular veins. Prolonged standing, irrespective of the occupation of the patient, is associated with the development of B/L reticular veins and B/L varicose veins.
Keywords
Varicose veins
Inflammatory biomarkers
Fibrinogen
Serum tPA
Serum PAI-1

INTRODUCTION
Varicose veins are the most common form of chronic venous diseases of the lower limbs, affecting up to 30% of the population with a slightly higher prevalence in women than in men (25–33% and 10–20%, respectively).[1–4] Incidence of varicose veins in the adult population has been shown to vary among populations (between 10% and 60%) and to increase with age in various studies.[5–10] Enhanced oxidative stress has been implicated as the causative mechanism behind vessel wall injury in recent studies.[11] Reactive oxygen species (ROS) are involved in the blood coagulation cascade.[12] Experimental data have demonstrated that ROS can modify the fibrinolytic response, affecting the production of tissue Plasminogen Activator (tPA) and its inhibitor Plasminogen Activator Inhibitor-1 (PAI-1), increasing PAI-1 expression by endothelial cells.[13–15] Several hematological abnormalities, such as increased blood cell count and aggregation, increased low-shear rate viscosity, and elevation in plasma fibrinogen, have been identified in venous blood samples collected from the feet of patients with chronic venous diseases.[16,17] Therefore, this study aims to assess the biomarkers of inflammation and blood viscosity as predictive markers in patients with primary bilateral varicose veins or reticular veins that might progress to varicose veins.
MATERIAL AND METHODS
The cross-sectional study with a sample size of 40 patients from 9 different occupations was conducted in the Post Graduate Department of General Surgery, Moti Lal Nehru (MLN) Medical College, Prayagraj, for a period of 1 year from October 2021 to September 2022. The Institutional Ethics Committee (IEC) of MLN Medical College, Prayagraj, has approved this study; approval reference number is - (ECR/922/inst/UP/2017). Patients, including policemen, students, farmers, teachers, surgeons, housewives, army officers, tea stall owners, and guards, aged between 18 and 65 years and admitted to the unit with bilateral primary varicose veins/reticular veins falling under reticular veins and symptomatic varicose veins (C1, 2s), primary etiology (Ep), superficial veins (As), reflux pathology (Pr) categories of Clinical, Etiologic, Anatomic, Patho-physiologic (CEAP) classification classifying chronic venous diseases with the exception of those with telangiectatic veins, were included in the study.[18] This includes patients with clinically present symptomatic bilateral reticular veins and varicose veins of primary etiology in superficial venous system with reflux pathophysiology. Blood samples were taken from the involved varicose veins in the study group and in the control group and sent for evaluation, and blood viscosity was measured using Capillary Viscometer. Evaluated inflammatory markers were:
tPA
PAI-1
Fibrinogen
Serum tPA levels (ng/mL), serum PAI-1 levels (ng/mL) and serum fibrinogen levels (mg/dL) were measured using quantitative enzyme-linked immunosorbent assay (ELISA), which followed the Sandwich-ELISA principle. The concentration of inflammatory biomarkers in the samples was calculated by comparing the optical density (OD) of the samples to the standard curve. Blood viscosity of venous blood samples was measured using Capillary Viscometer based on Poiseuille’s Law using the following formula:
where ρ is the blood density, t is the time of outflow of the sample, ρ0 and t0 are density and the time of outflow of the reference liquid (water) respectively. The final analysis was done with the help of Microsoft EXCEL and Statistical Package for the Social Sciences (SPSS) software. For statistical significance, p-value less than 0.05 was considered.
RESULTS
The control group included 20 participants with CEAP grade C0. Study group of 20 participants was divided into the C1 study group, which included 6 patients who had C1, Ep, As and Pr with bilateral reticular veins, and the C2 study group, which included 14 patients who had symptomatic bilateral varicose veins (C2s, Ep, As, and Pr) [Figure 1].
The highest number of cases was in the age group of 31–40 years [Figure 2].
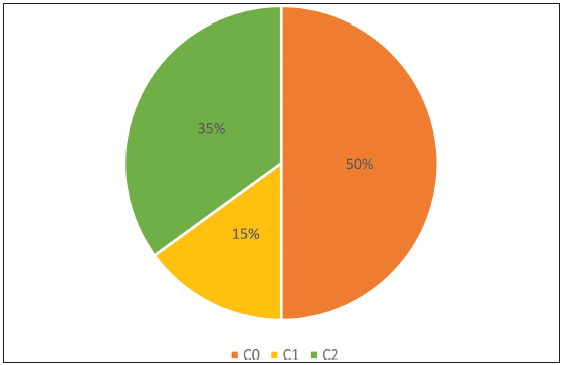 Figure 1:
- Distribution of cases vs. control; C0: Control group, C1: Study group, C2: Study group.
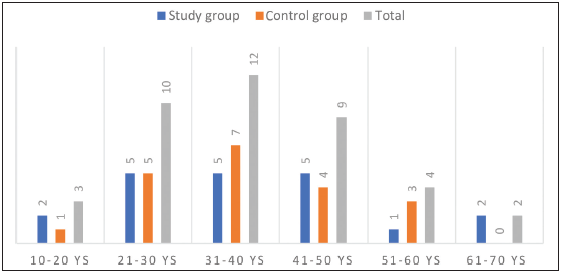 Figure 2:
- Distribution of patients according to age intervals.
Mean age of male and female patients was 38.67 ± 13.31 and 33.3 ± 6.88 years, respectively.
Mean ages of male patients in the study group and control group were 40 ± 15.65 and 37.5 ± 11.28 years, respectively, while that of female patient in the study group, and the control group were 30.67 ± 5.79 and 37.25 ± 7.18 years, respectively.
The male–female ratio was 3:1. The ratio in the study group was 7:3 and the ratio in the control group was 4:1. Both the groups contained mainly male patients for the study (70% in the study group and 80% in the control group).
Occupation and standing hours
There was a statistically insignificant relationship between occupation and different study groups, χ 2(16) = 8.2, p-value = 0.943, Cramér’s V = 0.32.
Mean standing hours value was 5.9 ± 2.12 hours [Table 1].
Table 1: Standing hours versus different groups.N Mean Std. Deviation C0 20 4.4 1.05 C1 6 6.33 1.97 C2 14 7.86 1.66 Total 40 5.9 2.12 C0: Control group, C1: Study group, C2: Study group, N: number of participants in each group
-
Mean value of standing hours showed an increasing trend with the lowest value in the control group C0, followed by the study group C1, and the highest value in the study group C2 [Figure 3].
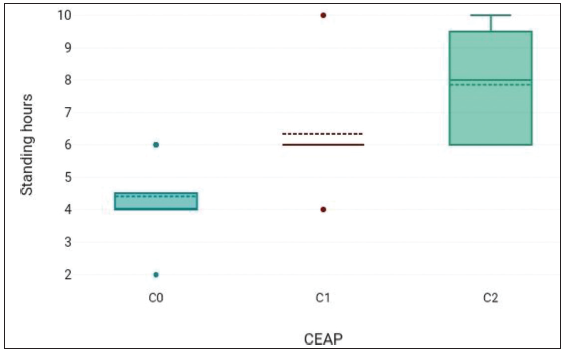 Figure 3:
- Standing hours in different groups; C0: Control group, C1: Study group, C2: Study group, CEAP: Clinical, etiological, anatomical, and pathophysiologic.
Standing hours had a significant difference in different study groups. F = 24.33, p-value = <0.001.
The Analysis of Variance (ANOVA) showed that there was a significant difference.
The Bonferroni post-hoc test revealed that the pairwise group comparisons of C2–C0 and C1–C0 had a p-value less than 0.05, and thus, these groups were each significantly different pairwise [Tables 2 and 3].
Table 2: Fisher’s test: Standing hours versus different groups.Variables Average difference t p-value C2–C1 1.52 2.18 0.036 C2–C0 3.46 6.93 <0.001 C1–C0 1.93 2.9 0.006 C0: Control group, C1: Study group, C2: Study group; t-test: compares the means between two groups
Table 3: Bonferroni test: Standing hours versus different groups.Mean diff. Std. Error p-value 95% CI lower limit 95% CI upper limit C2–C1 1.52 0.699 0.107 ‒0.24 3.29 C2–C0 3.46 0.499 <0.001 2.2 4.72 C1–C0 1.93 0.666 0.019 0.25 3.62 C0: Control group, C1: Study group, C2: Study group, CI: Confidence Interval
Blood viscosity
Mean blood viscosity was 1.49 ± 0.07.
Blood viscosity showed an insignificant difference between different study groups. F = 0.12, p-value = 0.885.
Serum tPA
Mean serum tPA levels were 53.06 ± 8.46 ng/mL.
Mean value of serum tPA was the highest in the C2 study group, followed by C0 control group. Lowest mean value of serum tPA was seen in the C1 study group.
Serum tPA had an insignificant difference between different study groups. F = 0.66, p-value = 0.523.
Serum PAI-1
Mean serum PAI-1 level was 12.79 ± 6.39 ng/mL.
Mean value of serum PAI-1 was the highest in the C1 study group, followed by the C2 study group. Lowest mean value of serum PAI-1 was seen in the C0 control group.
Serum PAI-1 showed no significant difference between different study groups. F = 0.3, p-value = 0.741.
Serum fibrinogen
Mean serum fibrinogen value was 173.29 ± 55.34 mg/dL [Table 4].
Table 4: Fibrinogen versus CEAP.N Mean Std. Deviation C2 14 237.26 48.09 C1 6 143.37 11.11 C0 20 137.48 4.92 Total 40 173.29 55.34 CEAP: Clinical, etiological, anatomical, and pathophysiologic, C0: Control group, C1: Study group, C2: Study group; N: number of participants in each group
Mean value of serum fibrinogen levels showed an increasing trend with the lowest value in the control group C0, followed by the study group C1, and the highest value in the study group C2 [Figure 4].
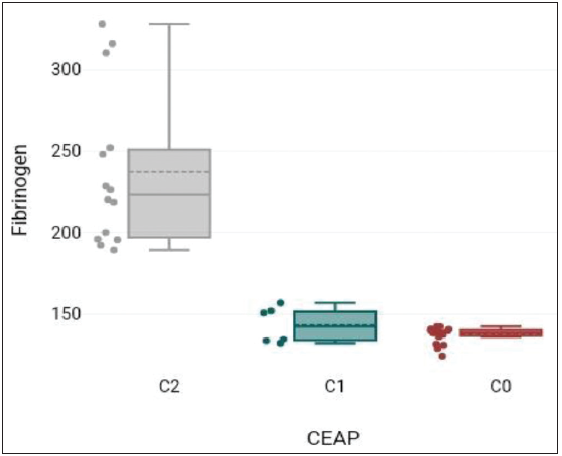 Figure 4:
- Fibrinogen versus CEAP: Clinical, etiological, anatomical, and pathophysiologic; C0: Control group, C1: Study group, C2: Study group.
Serum fibrinogen levels showed a significant difference between different study groups. F = 52.47, p-value = <0.001.
The ANOVA showed that there was a significant difference between different groups.
The Bonferroni post-hoc test revealed that the pairwise group comparisons of C2–C1 and C2–C0 had a p-value less than 0.05 and thus these groups were each significantly different pairwise [Tables 5 and 6].
Table 5: Fisher’s test: Fibrinogen versus CEAP.Variables Average difference t p-value C2–C1 93.89 6.63 <0.001 C2–C0 99.78 9.87 <0.001 C1–C0 5.89 0.44 0.665 CEAP: Clinical, etiological, anatomical, and pathophysiologic, C0: Control group, C1: Study group, C2: Study group; t-test: compares the means between two groups
Table 6: Bonferroni test Fibrinogen versus CEAP.Mean diff. Std. Error p-value 95% CI lower limit 95% CI upper limit C2–C1 93.89 14.155 <0.001 58.1 129.67 C2–C0 99.78 10.109 <0.001 74.22 125.33 C1–C0 5.89 13.503 1 −28.25 40.03 CEAP: Clinical, etiological, anatomical, and pathophysiologic, C0: Control group, C1: Study group, C2: Study group, CI: Confidence Interval
DISCUSSION
In the present study, the mean age of patients with bilateral (B/L) varicose veins, reticular veins, and the control group was 35.14 ± 11.9, 42 ± 18.33 and 37.33 ± 12.18 years, respectively. Maximum patients belonged to the age group of 31–40 years. The difference between the different groups and the age of patients was statistically insignificant in contrast with Shafiuddin M et al. (2017) where most of the patients belonged to the age group of 21–30 years.[19] The incidence of disease was found to be more in males as compared to females in B/L reticular veins patients and in B/L varicose veins patients. The lower incidence in females was probably due to less cosmetic concern in the middle and lower-class strata.
The relationship between occupation and different study groups was statistically insignificant. However, an increasing trend of mean value of standing hours was the lowest in the control group, followed by B/L reticular veins patients, and the highest in patients of B/L varicose veins. The relationship between the mean duration of standing hours in different study groups is statistically significant. In pairwise group comparisons, B/L varicose veins versus control group and B/L reticular veins versus control group, both groups have shown statistically significant difference. The difference between patients of B/L reticular veins and B/L varicose veins was statistically insignificant. Hence, the result that prolonged standing hours are associated with the development of B/L reticular or varicose veins irrespective of the occupation is in line with Shafiuddin M et al. (2017), Mirji et al. (2011) and Nagraj et al. (2014).[19–21]
The highest mean blood viscosity values are found in patients of B/L reticular veins, followed by patients of B/L varicose veins and the control group. The relation between different study groups and blood viscosity was statistically insignificant. The results are in sync with Flore et al. (2015)[22] and contrary to Androulakis & Panoysis et al. (1989).[23]
The mean serum tPA values were in patients of B/L varicose veins, followed by the control group. The lowest mean value of serum tPA was seen in patients of B/L reticular veins. The relation between different study groups and serum tPA levels was statistically insignificant and in line with Shireman et al. (1996)[8] and Yasim & Kilinç et al. (2007)[24] and in contrast with Blomgren et al. (2001).[15]
The mean value of serum PAI-1 in patients of B/L reticular veins was followed by patients of B/L varicose veins. The lowest mean value of serum PAI-1 was seen in the control group. The relationship between mean serum PAI-1 values, and different study groups was statistically insignificant and consistent with Shireman et al. (1996)[8] and in contrast to Blomgren et al. (2001).[15]
There is an increasing trend of mean value of serum fibrinogen levels with the lowest value in the control group followed by B/L reticular veins patients, and the highest value in patients of B/L varicose veins. The relationship between the mean serum fibrinogen levels in different study groups is statistically significant. In pairwise group comparisons, B/L varicose veins versus the control group, and B/L varicose veins versus B/L reticular veins, both groups have shown statistically significant difference. The difference between patients of B/L reticular veins and the control group was statistically insignificant. Hence, it is concluded that raised fibrinogen levels are associated with the development of B/L varicose veins, and not with B/L reticular veins. The results are consistent with Pola et al. (1994),[17] Flore et al. (2015),[22] Karahan et al. (2016),[25] Tiwary & Kumar et al. (2020)[26] and contrary to Yasim & Kilinç et al. (2007)[24] and Gomez et al. (2012).[27]
LIMITATIONS OF THE STUDY
Due to time constraints and the limited availability of specific patients during the study period, the sample size was small and the results cannot be generalized to the whole population and so a predictive range of fibrinogen for the general population cannot be decided upon. Therefore, further extensive study with a large sample size is required to generate standard cut-offs.
The results cannot be extended to cases of unilateral (U/L) primary varicose veins.
The number of male patients was significantly higher than female cases. Therefore, gender bias, if any, has not been fully accounted for.
CONCLUSION
On the basis of our study, we conclude that blood viscosity and biomarkers of inflammation, that is, tPA and PAI-1 cannot be used as predictive markers in patients with bilateral primary varicose veins/reticular veins. Serum fibrinogen levels cannot be used as predictive markers for B/L reticular veins but they can be used as predictive markers for the development of B/L primary varicose veins and in our particular study with a predictive range of 189.4–327.9 mg/dL. The study also concludes that prolonged standing, irrespective of the occupation of the patient, is associated with the development of B/L reticular veins as well as B/L varicose veins.
Ethical approval
The Institutional Ethics Committee (IEC) of MLN Medical College, Prayagraj, has approved this study; approval reference number is - (ECR/922/inst/UP/2017).
Declaration of patients consent
Patient’s consent not required as patient’s identity is not disclosed or compromised.
Financial support and sponsorship
Nil.
Conflicts of interest
There are no conflicts of interest.
Use of Artificial Intelligence (AI)-Assisted Technology for manuscript preparation
The authors confirm that there was no use of Artificial Intelligence (AI)-Assisted Technology for assisting in the writing or editing of the manuscript and no images were manipulated using the AI.
REFERENCES
- Prevalence of Varicose Veins and Chronic Venous Insufficiency in Men and Women in the General Population: Edinburgh Vein Study. J Epidemiol Community Health. 1999;53:149-53.
- [CrossRef] [PubMed] [Google Scholar]
- The Epidemiology of Chronic Venous Insufficiency and Varicose Veins. Ann Epidemiol. 2005;15:175-84.
- [CrossRef] [PubMed] [Google Scholar]
- Epidemiology of Chronic Venous Disease. Phlebology. 2008;23:103-11.
- [CrossRef] [PubMed] [Google Scholar]
- Epidemiology of Chronic Venous Disorders in Geographically Diverse Populations: Results from the Cein Consult Program. Int Angiol. 2012;31:105-15.
- [PubMed] [Google Scholar]
- Effects of Vasoactive Agents in Healthy and Diseased Human Saphenous Veins. J Vasc Surg. 1998;28:855-61.
- [CrossRef] [PubMed] [Google Scholar]
- 8-epi-PGF 2α and 6-oxo-PGFα in Human (Varicose) Veins: Influence of Age, Sex, and Risk Factors. Angiology. 2003;54:317-24.
- [CrossRef] [PubMed] [Google Scholar]
- Investigation of Chronic Venous Insufficiency: A Consensus Statement. Circulation. 2000;102:e126-e163.
- [CrossRef] [PubMed] [Google Scholar]
- Plasminogen Activator Levels are Influenced by Location and Varicosity in Greater Saphenous Vein. J Vasc Surg. 1996;24:719-24.
- [CrossRef] [PubMed] [Google Scholar]
- Pathogenesis of Varicose Veins. Eur J Vasc Endovasc Surg. 2003;25:319-24.
- [CrossRef] [PubMed] [Google Scholar]
- Symptoms of Chronic Venous Disease and Association with Systemic Inflammatory Markers. J Vasc Surg. 2003;38:950-4.
- [CrossRef] [PubMed] [Google Scholar]
- A Plasma Oxidative Stress Global Index in Early Stages of Chronic Venous Insufficiency. J Vasc Surg. 2013;57:205-13.
- [CrossRef] [PubMed] [Google Scholar]
- Redox Regulation of the Coagulation Cascade. Antioxid Redox Signal. 2005;7:1398-404.
- [CrossRef] [PubMed] [Google Scholar]
- Tissue Plasminogen Activator and Plasminogen Activator Inhibitor-1 Levels in Patients with Acute Paraquat Intoxication. J Korean Med Sci. 2011;26:474-81.
- [CrossRef] [PubMed] [PubMed Central] [Google Scholar]
- Nox4 Mediates the Expression of Plasminogen Activator Inhibitor-1 Via P38 Mapk Pathway in Cultured Human Endothelial Cells. Thromb Res. 2009;124:439-46.
- [CrossRef] [PubMed] [Google Scholar]
- Coagulation and Fibrinolysis in Chronic Venous Insufficiency. Vasa. 2001;30:184-7.
- [CrossRef] [PubMed] [Google Scholar]
- Blood Rheology as a Marker of Venous Hypertension in Patients with Venous Disease. Clin Hemorheol Microcirc. 2004;30:307-12.
- [PubMed] [Google Scholar]
- The 2020 Update of the CEAP Classification System and Reporting Standards. J Vasc Surg. 2020;8:342-52.
- [CrossRef] [PubMed] [Google Scholar]
- Study of Risk Factors and Clinical Assessment of Lower Limb Varicose Vein in a Tertiary Care Hospital. Int Surg J. 2017;4:2480-3.
- [Google Scholar]
- Study of Clinical Features and Management of Varicose Veins of Lower Limb. J Clin Diagn Res. 2012;5:1416-20.
- [Google Scholar]
- Prospective Clinical Study of Surgical Management of Varicose Veins of Lower Limb and its Complications 2014. VHL Regional Portal IMSEAR | ID: sea-150620
- [Google Scholar]
- Biomarkers of Low-Grade Inflammation in Primary Varicose Veins of the Lower Limbs. Eur Rev Med Pharmacol Sci. 2015;19:557-62.
- [PubMed] [Google Scholar]
- Plethysmographic Confirmation of the Beneficial Effect of Calcium Dobesilate in Primary Varicose Veins. Angiology. 1989;40:1-4.
- [CrossRef] [PubMed] [Google Scholar]
- Serum Concentration of Procoagulant, Endothelial and Oxidative Stress Markers in Early Primary Varicose Veins. Phlebology. 2008;23:15-20.
- [CrossRef] [PubMed] [Google Scholar]
- Simple Blood Tests as Predictive Markers of Disease Severity and Clinical Condition in Patients with Venous Insufficiency. Blood Coagul Fibrinolysis. 2016;27:684-90.
- [CrossRef] [PubMed] [Google Scholar]
- Study of Association of Varicose Veins and Inflammation by Inflammatory Markers. Phlebology. 2020;35:679-85.
- [CrossRef] [PubMed] [Google Scholar]
- Absence of Inflammatory Conditions in Human Varicose Saphenous Veins. Inflamm Res. 2013;62:299-308.
- [CrossRef] [PubMed] [Google Scholar]


